Cognos Analytics Report – How long should they take to run?
How to work out how long queries in a Cognos Analytics report take to run
One question I have been asked quite a few times is ‘I have a report that is taking a long time to run and I don’t know why?’.
So, how I approach this is as follows:
- Identify which queries are my slow running queries?
- Look at optimising them by running them concurrently and therefore reduce the report execution time.
- Look at the SQL and use database tools to identify performance improvements.
By taking this approach, I have successfully reduced execution times of reports from an hour to literally 30 seconds.
This article looks at the first of these steps on how to identify those slowly executing queries.
Setup:
- Locate the file xqe.diagnosticlogging.xml in the configuration directory of your Cognos Analytics (or Cognos 10 BI) installation.
- Open the file using a text editor and look for a section called ‘<component name=”XQE”>’. This contains a number of lines called Event Groups.
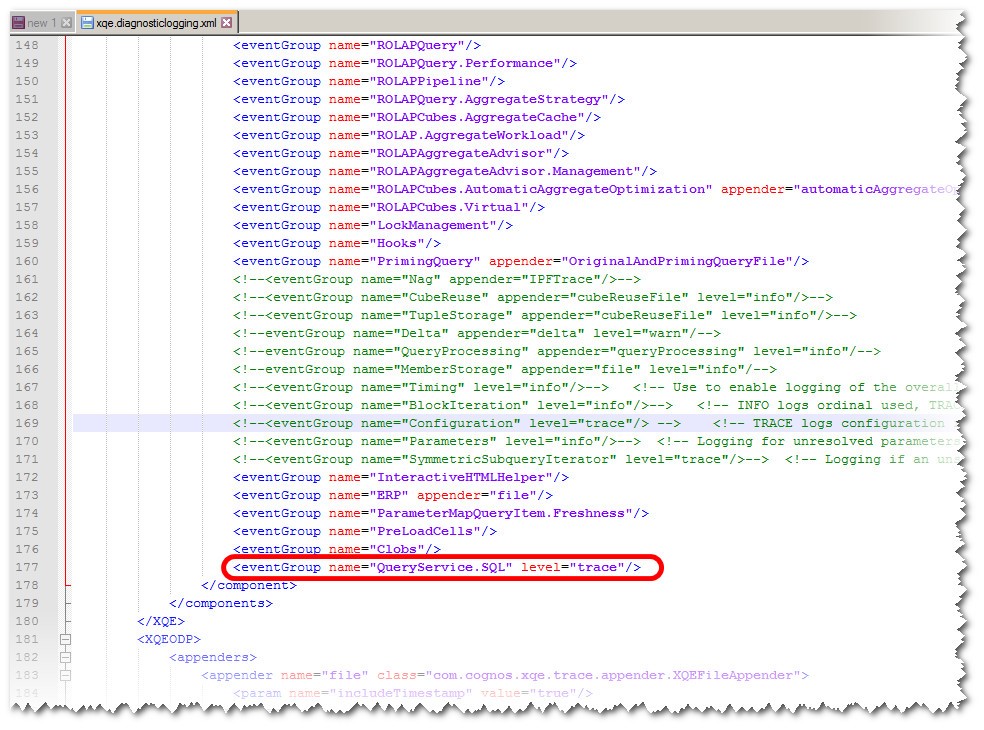
- Go to the bottom of the list of event groups and add a new one with the text ‘<eventGroup name=”QueryService.SQL” level=”trace”/>’. The screenshot below shows what the finished line looks like.

4. Finally, restart the IBM Cognos service that is running on your server. Please remember that you must make this change for every server in your environment that has report dispatching capabilities. Once restarted every query execution will be logged.
Testing:
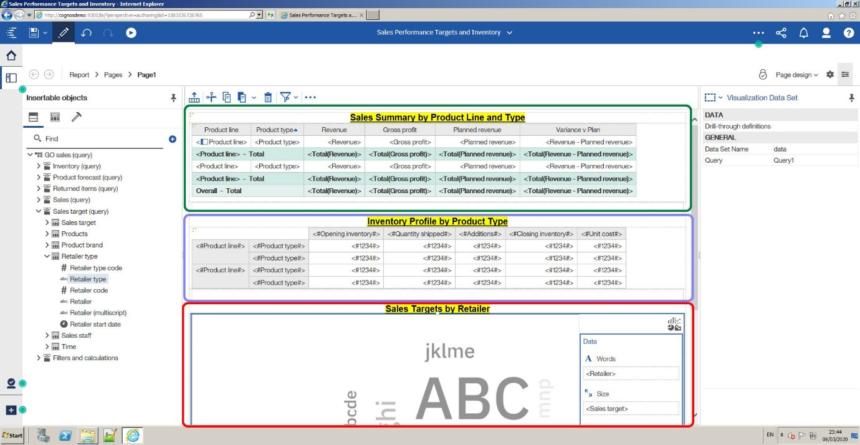
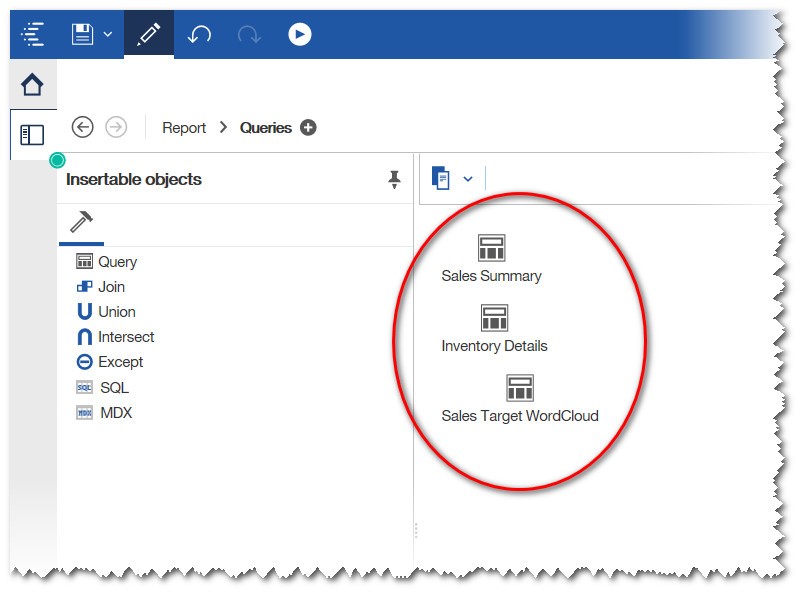
In order to test the new level of logging, I have created a report using the relational samples. The report contains three frames, a list, a crosstab, and a word cloud visualisation. Each frame is supported by a single query.
Below is the design of my report and the list of queries that support it.


When I execute the report, the report successfully completes, and I want to review the information captured.
In order to do this, I need to navigate to the dispatching server that the report was executed from and look for ‘xqelog’ log files. These files are timestamped and grow to be 10mb in size. They reside in the <install location>\logs\xqe folder on each dispatcher.
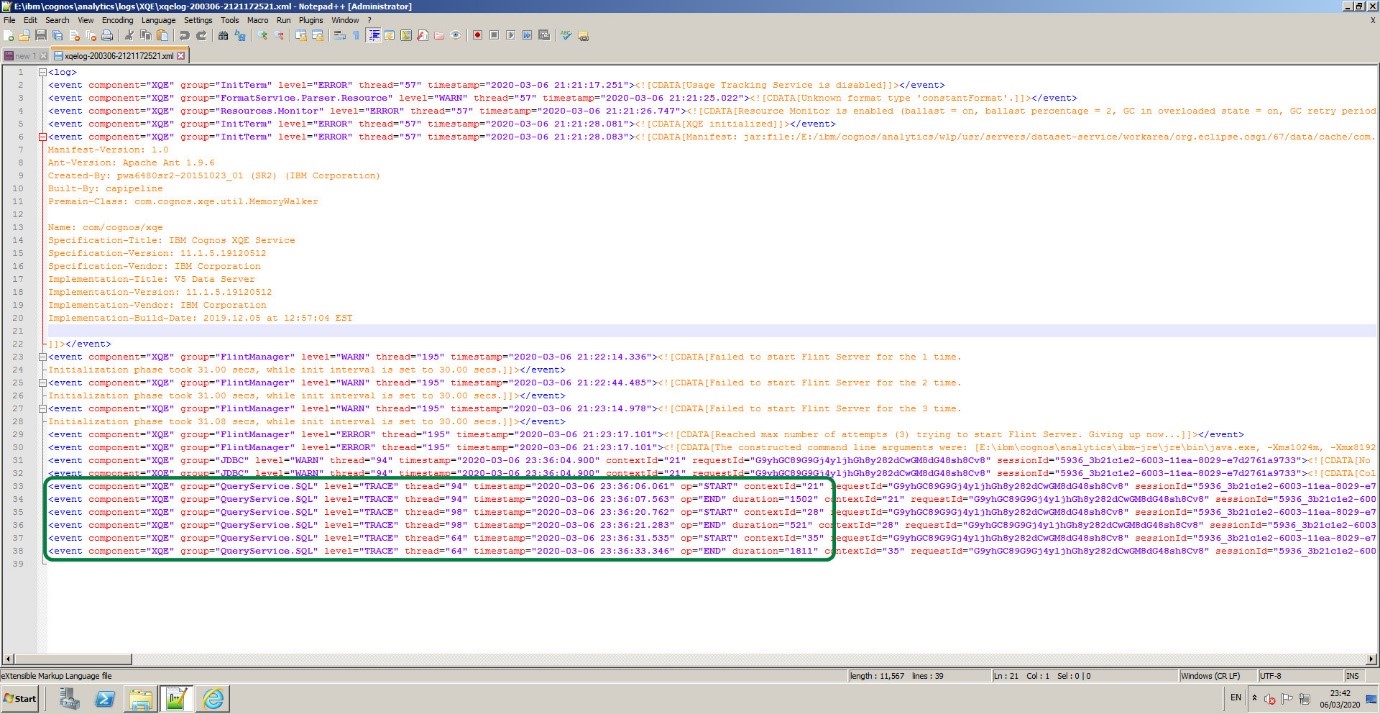
When you have identified the XQE log file, open it and you will see something similar to the screenshot below in terms of the format.

This is the actual log from execution of the report I created. As you will see we have six lines of information, three START lines, and three END lines. These are the actual times that the Report Dispatcher submitted the queries and received the results back. Each query has its own thread and as you can see they are in sequence.
Outside the view of the screenshot is the actual SQL statement submitted which you can cut and paste into your favorite query analyser tool such as SQL Server Management Studio.
Evaluation and Improvement:
The kind of information I am looking for is the ‘duration’ which is in thousandths of a second. I often list the queries in a spreadsheet and capture the durations so I can ascertain the split between a reports queries executing and the time the dispatcher then uses to render the actual report output (xlsx, pdf, html etc) using the Presentation Service.
Taking my example report results I can see that:
1. Query 1 took 1.502 seconds to complete
2. Query 2 took 0.521 seconds to complete
3. Query 3 took 1.811 seconds to complete
4. They all ran in sequence and used a thread each.
The report took a total of 5.1 seconds to render as HTML onto the screen (stats is taken from my Cognos Audit database COGIPF_RUNREPORT table) therefore my rough split of a query execution to the report rendering is 3.83 seconds query execution and 1.27 seconds HTML generation and display.
Once I have this information, I consider the following:
1. Ways to reduce the report execution duration using concurrent query execution.
2. Ways to improve query performance.
3. Ways to reduce the number of queries in order to use queries for more than one frame.
In the next article, I will show you how to set-up concurrent query execution and see the impact it has on our test report.
Cognos version 11.1.x reached the end of support on April 30, 2024. It’s time to upgrade for enhanced performance and security.
With the release of version 12, it’s even more important for organisations to ensure they’re on a supported long-term release version of Cognos Analytics


